![]()
| Alekseev A.S. | Glinsky B.M. | Korneev V.D. |
| Khajdukov V.G. | Kostin V.I. | Kovalevsky V.V. |
| Malyshkin V.E. | Tcheverda V.A. | Vishnevsky D.M. |
Trefethen L.N., Halpern N. Well-posedness of one-way wave equations and absorbing boundary conditions. Math. Comp., v. 47, 1986, pp. 421-435.
Engquist B., Majda A. Absorbing boundary condition for the numerical simulation of waves. Math. Comp., v. 31, 1977, pp. 629-651.
Malyshkin V. Linearized mass computations. - In Proceedings of PaCT-91 International conference, September 1991, Novosibirsk, Russia. World Scintific, Singapore, pp.339-354.
Within the framework of the Program "Vibromonitoring of the Earth" in Siberian Division of Russian Academy of Sciences powerful controlled seismic vibrator was created and tested. A lot of real experiments with this vibrator proved its capacity to provide stable seismic signal up to the distance of 2000 km for harmonic-wave operation and of 300 km for impulse mode. At present stability of these vibrators with respect to frequency is 0.00001, with respect to the phase less than 1 degree and with respect to amplitude 5%. This opens a possibility to follow rather small variations of mechanical properties produced by the earthquake preparation process for a specific area suspected to be a seismic source zone.
The paper is devoted to investigation of the following problems of primary importance for foundation of vibromonitoring:
To answer these questions the finite-difference simulation of the acoustic wave equation in heterogeneous media was implemented on multicomputer Parsytec PowerXplorer (8 nodes with PowerPC-601, 80Mh, 8Mb memory of each node). The explicite second order in time and space finite-difference scheme with Courant number equal to 0.5 and second order absorbing boundary conditions ([1],[2]) were used. An action of a vibrator was treated as a point source on the free surface with time function
![]()
The specific of the problem is large source-geophones distances (about 40 km) and necessity to possess seismograms for rather long times (100 - 200 sec) in order to see how harmonic-wave operation mode is stabilized in time. This leads to huge arrays of a wave propagation velocities and simulated wavefield (1000 x 250 grid in space).
Input data were presented by the matrix of 1000 x 250 elements, describing distribution of the wave propagation velocities. Two series of numerical experiments were performed. The first one for a horizontally homogeneous medium with three layers over homogeneous half-plane:
| 0 <= z < 2km | c = 2km/sec | (1) | ||
| 2km <= z < 6km | c = 3km/sec | (2) | ||
| 6km <= z < 10km | c = 4km/sec | (3) | ||
| 10km <= z | c = 6km/sec | (4) |
The second one for the same layered medium but with a local lateral inhomogenuity being the square 4km x 4km within the last layer with 1% of velocity perturbation and placed at the 20 km from the source.
Parallel implementation of the model was performed at the basis the method of linearized mass computations ([3]). In accordance with this method matrix was divided into 8 overlapping layers (line of layers) with 1 columns in each overlapping on the right and on the left (excluding side layers). Each layer was assigned for iterative processing on separate PE. After each iteration the exchange of columns of overlapping has been doing to restore their correct values. This method of problem parallelization is an standard element of assembly technology that provides successful development of high performance parallel programs.
The results of numerical simulation of harmonic-wave operation mode one can see on Fig.1-Fig.2. It is necessary to pay the attention of the reader to rather complicated process of stabilization, varying with the distance. In comparence on Fig.3 the wavefield with impulse source function is presented.
a) 
b) 
c) 
Figure 1. Harmonic-wave operation mode at distance 15 km for layered medium without (a) and with (b) velocity perturbation and their difference (c). For getting more detailed image click here
a) 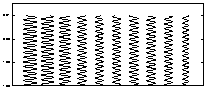
b) 
c) 
Figure 2. The same as Fig.1 but stretched in time For getting more detailed image click here
a) 
b) 
c) 
Figure 3. Harmonic-wave operation mode at distance 40 km for layered medium without (a) and with (b) velocity perturbation and their difference (c) For getting more detailed image click here
a) 
b) 
c) 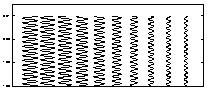
Figure 4. The same as Fig.3 but stretched in time For getting more detailed image click here
a) 
b) 
c) 
Figure 5. Impulse mode at distance 40 km for layered medium without (a) and with (b) velocity perturbation and their difference (c) For getting more detailed image click here
a) 
b) 
c) 
Figure 6. The same as Fig.5 but stretched in time For getting more detailed image click here
In order to analyze sensitivity of harmonic wavefield to velocity perturbation
we estimated its amplitude and phase deviation. To do that the wavefield
over the interval 150 - 200 s (i.e. when the process is alreadt stabilized)
was treated as  for laterally homogeneous layered background and
 for layered background
with local velocity perturbation,
where j is the number of geophone and
for layered background
with local velocity perturbation,
where j is the number of geophone and  and
and  are
amplitude and phase deviations because of this local perturbation.
On Fig. 7 are presented the absolute phase deviation
and the relative amplitude one. It seems to be natural to estimate sensitivity
of a harmonic wavefield via some norm of these deviations and to deal
with phase sensitivity and amplitude sensitivity
are
amplitude and phase deviations because of this local perturbation.
On Fig. 7 are presented the absolute phase deviation
and the relative amplitude one. It seems to be natural to estimate sensitivity
of a harmonic wavefield via some norm of these deviations and to deal
with phase sensitivity and amplitude sensitivity
 . The obviuos conclusion
is that the phase sensitivity is much more in comparence with
the amplitude one and both
have general tendency to increase with respect to source-geophone distance.
. The obviuos conclusion
is that the phase sensitivity is much more in comparence with
the amplitude one and both
have general tendency to increase with respect to source-geophone distance.
To conclude, we would like to lay particular stress to the fact, that a rather small perturbation of the velocity produces rather significant phase deviations (up to 10 degrees) of the harmonic wavefield those lie within the accuracy of equipment developed in the Computing Center of SD RAS (we mean mentioned above powerful seismic vibrators and recording system with a signal accumulation).
a) 
b) 
Figure 7. The phase (a) and amplitude (b) sensitivity of harmonic wavefield at distances 15 km (solid line) and 40 km (dashed lone) For getting more detailed image click here
This research has been partially supported from the grants ITDC-203, RFBR 96-01-01557, RFBR 96-01-01515, RFBR 96-05-65600, RFBR 95-05-15552